August 8, 2026 19 views news
Youth Athlete Performance Benchmarks: A Practical Guide
By BabyLoveGrowth.ai
<script type="application/ld+json">
{
"@graph": [
{
"@type": "Article",
"image": {
"url": "https://csuxjmfbwmkxiegfpljm.supabase.co/storage/v1/object/public/blog-images/organization-34605/1786201455264_Youth-athlete-sprinting-on-outdoor-track.jpeg",
"@type": "ImageObject",
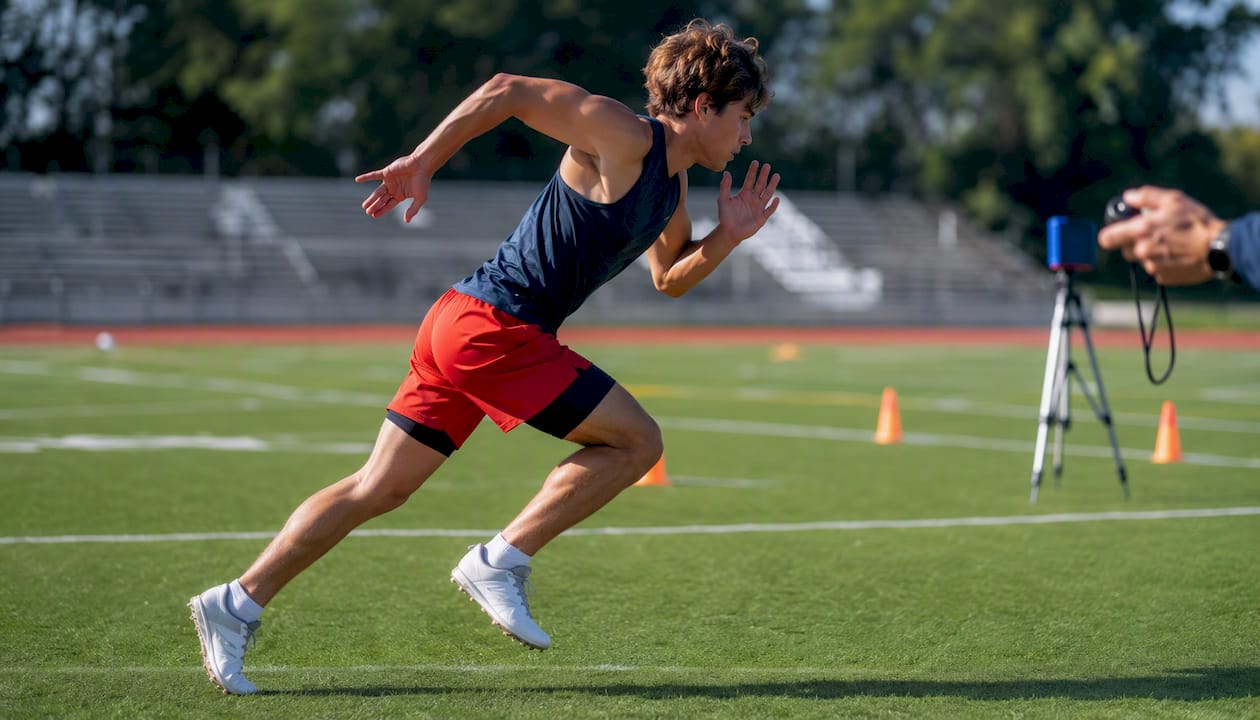
"caption": "Youth athlete sprinting on outdoor track"
},
"author": {
"url": "https://nationalscoutingbureau.com",
"name": "Nationalscoutingbureau",
"@type": "Organization"
},
"headline": "Youth Athlete Performance Benchmarks: A Practical Guide",
"publisher": {
"url": "https://nationalscoutingbureau.com",
"name": "Nationalscoutingbureau",
"@type": "Organization"
},
"inLanguage": "en-US",
"description": "Discover key benchmarks for youth athlete performance stats to assess progress and enhance training results with our practical guide.",
"dateModified": "2026-08-08T15:14:08.367Z",
"datePublished": "2026-08-08T15:14:08.367Z"
},
{
"@type": "BreadcrumbList",
"itemListElement": [
{
"item": "https://nationalscoutingbureau.com",
"name": "Nationalscoutingbureau",
"@type": "ListItem",
"position": 1
},
{
"item": "https://nationalscoutingbureau.com/benchmark-youth-athlete-performance-stats",
"name": "Youth Athlete Performance Benchmarks: A Practical Guide",
"@type": "ListItem",
"position": 2
}
]
}
],
"@context": "https://schema.org"
}
</script>
<h1 id="youth-athlete-performance-benchmarks-a-practical-guide" tabindex="-1">Youth Athlete Performance Benchmarks: A Practical Guide</h1>
<p><img src="https://csuxjmfbwmkxiegfpljm.supabase.co/storage/v1/object/public/blog-images/organization-34605/1786201455264_Youth-athlete-sprinting-on-outdoor-track.jpeg" alt="Youth athlete sprinting on outdoor track"></p>
<p>Benchmarking stats for youth athletes are age/sex/maturation-adjusted reference values — percentiles and age-grades derived from standard tests — that tell you exactly where an athlete stands against peers and whether progress is real. The fastest way to apply them: run a 3–5 test battery (10 m sprint, countermovement jump, change-of-direction, aerobic capacity), record raw scores alongside a biological maturity estimate using Peak Height Velocity (PHV), then map each result to a published percentile table. Organizations like Nationalscoutingbureau use FlightScope technology to add verified velocity metrics to that picture, producing recruitment-ready profiles that go beyond a stopwatch and a clipboard.</p>
<p>Here’s the short-action checklist to get started right now:</p>
<ul>
<li>Run a 3–5 test battery covering speed, power, agility, and aerobic capacity</li>
<li>Record raw scores with units (seconds, centimeters, mL·kg⁻¹·min⁻¹)</li>
<li>Estimate biological maturity using PHV offset (years from peak height velocity)</li>
<li>Map each score to a published, age/sex-specific percentile table</li>
<li>Set one SMART training goal per test where the athlete falls below P50</li>
</ul>
<hr>
<h2 id="key-takeaways" tabindex="-1">Key Takeaways</h2>
<p>Maturity-adjusted percentiles from standardized tests are the most reliable way to evaluate a youth athlete’s true development level and set training priorities that hold up over time.</p>
<table>
<thead>
<tr>
<th>Point</th>
<th>Details</th>
</tr>
</thead>
<tbody>
<tr>
<td>Run a 3–5 test battery</td>
<td>Sprint (10 m/30 m), CMJ, CoD, and an aerobic test cover the essential physical qualities for most sports.</td>
</tr>
<tr>
<td>Adjust for biological maturity</td>
<td>PHV offset shifts percentile rank significantly; post-PHV athletes outperform pre-PHV peers by 0.25 s on 10 m sprint and ~7.5 mL·kg⁻¹·min⁻¹ on VO2max.</td>
</tr>
<tr>
<td>Use MDC to confirm real change</td>
<td>A change smaller than the MDC for your setup is measurement noise, not progress; calculate MDC before acting on any result.</td>
</tr>
<tr>
<td>Apply sex-specific norms from U14</td>
<td>Sex differences in sprint, CoD, and CMJ roughly double between U14 and U16; male norms misrepresent female athlete performance.</td>
</tr>
<tr>
<td>Nationalscoutingbureau verified testing</td>
<td>NSB combines FlightScope metrics with standardized field tests to produce percentile-mapped, recruitment-ready athlete profiles at 400+ college-partner institutions.</td>
</tr>
</tbody>
</table>
<hr>
<h2 id="table-of-contents" tabindex="-1">Table of Contents</h2>
<ul>
<li><a href="#which-tests-should-you-include-in-a-youth-benchmarking-battery">Which tests should you include in a youth benchmarking battery?</a></li>
<li><a href="#how-do-you-measure-reliably-with-standard-protocols">How do you measure reliably with standard protocols?</a></li>
<li><a href="#how-do-you-interpret-benchmark-results-fairly-using-percentiles-and-phv">How do you interpret benchmark results fairly using percentiles and PHV?</a></li>
<li><a href="#what-do-research-backed-percentile-ranges-look-like-for-us-youth-athletes">What do research-backed percentile ranges look like for U.S. youth athletes?</a></li>
<li><a href="#how-do-you-build-a-repeatable-benchmarking-schedule">How do you build a repeatable benchmarking schedule?</a></li>
<li><a href="#how-does-nationalscoutingbureau-apply-verified-testing-to-evaluate-youth-athletes">How does Nationalscoutingbureau apply verified testing to evaluate youth athletes?</a></li>
<li><a href="#how-do-diverse-populations-positions-and-maturation-rates-affect-benchmarking">How do diverse populations, positions, and maturation rates affect benchmarking?</a></li>
<li><a href="#what-benchmarking-actually-taught-me-about-developing-athletes">What benchmarking actually taught me about developing athletes</a></li>
<li><a href="#nationalscoutingbureau-gives-your-athlete-a-verified-edge-in-recruiting">Nationalscoutingbureau gives your athlete a verified edge in recruiting</a></li>
<li><a href="#sources">Sources</a></li>
</ul>
<h2 id="which-tests-should-you-include-in-a-youth-benchmarking-battery" tabindex="-1">Which tests should you include in a youth benchmarking battery?</h2>
<p>Not every test earns its place. The goal is a battery that is fast enough to complete in one session, sensitive enough to detect real change, and relevant to the athlete’s sport. Five categories cover the essentials.</p>
<p><strong>Sprint speed</strong> is the most universal metric. The 10 m split captures acceleration; the 30 m captures top-end speed. Record in seconds to two decimal places using timing gates. For baseball-specific contexts, <a href="https://nationalscoutingbureau.com/blog/standardized-assessment-tools-for-amateur-baseball-in-2026" target="_blank" rel="noopener">standardized assessment tools for amateur baseball</a> include 60-yard dash splits that map directly to recruiting standards.</p>
<p><strong>Change of direction (CoD)</strong> tests such as the 505 or T-test reveal lateral quickness. Record in seconds; note which foot leads for the 505 to catch asymmetries.</p>
<p><img src="https://csuxjmfbwmkxiegfpljm.supabase.co/storage/v1/object/public/blog-images/organization-34605/1786201451090_Youth-athlete-performing-change-of-direction-agility-test.jpeg" alt="Youth athlete performing change of direction agility test"></p>
<p><strong>Lower-body power</strong> is best captured with the countermovement jump (CMJ), measured in centimeters of height or watts of peak power via a force plate. When force plates aren’t available, the standing long jump (measured in centimeters) is a reliable field substitute.</p>
<p><strong>Basic strength</strong> can be assessed with a bodyweight squat hold for time or a relative grip-strength measure. These normalize well against body mass and require no expensive equipment.</p>
<p><strong>Aerobic capacity</strong> rounds out the battery. The Yo-Yo Intermittent Recovery Level 1 (YYIR1) or a 20 m multistage fitness test produces an estimated VO2max in mL·kg⁻¹·min⁻¹ and a Maximal Aerobic Speed (MAS) in m·s⁻¹.</p>
<h3 id="sport-priority-matrix" tabindex="-1">Sport-priority matrix</h3>
<table>
<thead>
<tr>
<th>Sport</th>
<th>Priority Tests (pick 3–5)</th>
<th>Key Units</th>
</tr>
</thead>
<tbody>
<tr>
<td>Baseball</td>
<td>10 m/30 m sprint, CMJ, CoD (505), grip strength</td>
<td>s, cm, kg</td>
</tr>
<tr>
<td>Soccer</td>
<td>10 m/30 m sprint, CMJ, YYIR1/MAS, CoD</td>
<td>s, cm, m·s⁻¹</td>
</tr>
<tr>
<td>Basketball</td>
<td>CMJ, 10 m sprint, CoD (T-test), standing long jump</td>
<td>cm, s</td>
</tr>
<tr>
<td>Track sprinters</td>
<td>10 m/30 m sprint, CMJ, standing long jump</td>
<td>s, cm</td>
</tr>
<tr>
<td>Endurance sports</td>
<td>YYIR1/VO2max, MAS, 30 m sprint, bodyweight squat</td>
<td>mL·kg⁻¹·min⁻¹, m·s⁻¹, s</td>
</tr>
</tbody>
</table>
<p>Secondary measures worth adding when resources allow: eccentric hamstring strength (Nordic curl hold), vertical stiffness (drop jump contact time), and basic anthropometrics (standing height, body mass, sitting height for PHV calculation). These normalize sprint and jump scores through allometric scaling and feed directly into maturity estimation.</p>
<p><strong>Technology that produces reliable results:</strong> timing gates (Brower, Freelap) for sprints; force plates or validated jump mats (Just Jump, Hawkin Dynamics) for CMJ; FlightScope radar for pitch velocity and bat speed in baseball; calibrated cycle ergometers or validated field tests for VO2max estimation.</p>
<hr>
<h2 id="how-do-you-measure-reliably-with-standard-protocols" tabindex="-1">How do you measure reliably with standard protocols?</h2>
<p>Raw numbers mean nothing if the testing conditions shift between sessions. Reliability is built into the protocol before the first athlete steps on the line.</p>
<ol>
<li><strong>Standardized warm-up:</strong> 8–10 minutes of progressive jogging, dynamic mobility, and 2–3 submaximal accelerations. Every athlete, every session, same sequence.</li>
<li><strong>Familiarization trials:</strong> For CMJ and CoD tests, give athletes one practice attempt before recording. Novice athletes improve 5–10% from trial 1 to trial 2 on unfamiliar tasks, so skipping familiarization inflates apparent gains at the next test.</li>
<li><strong>Number of trials:</strong> Two to three valid attempts per test, with the best score recorded. For sprint tests, two timed runs with a full recovery (3–5 minutes) between them is standard.</li>
<li><strong>Rest intervals:</strong> Minimum 2 minutes between sprint trials; 3–5 minutes between CMJ sets; 10–15 minutes between the sprint battery and the aerobic test.</li>
<li><strong>Environment controls:</strong> Same surface (artificial turf vs. grass changes sprint times), same footwear category, wind speed below 2.0 m·s⁻¹ for outdoor sprints, and consistent time of day (morning vs. afternoon affects CMJ by 2–4%).</li>
<li><strong>Equipment calibration:</strong> Timing gates need consistent gate height (hip for sprint, shin for CoD). Force plates require a zero-offset check before each session. FlightScope units need a level surface and consistent positioning relative to the athlete.</li>
<li><strong>Single test administrator:</strong> Rotate testers and your data drifts. One consistent administrator per test station is the cheapest reliability upgrade available.</li>
</ol>
<p>Reliability benchmarks to know: sprint timing with quality gates carries an intraclass correlation coefficient (ICC) of 0.90 or above; manual stopwatch timing drops that figure substantially and raises the minimal detectable change (MDC). MDC is calculated as: <strong>MDC = SEM × 1.96 × √2</strong>, where SEM is the standard error of measurement. For a 10 m sprint with an ICC of 0.92 and a typical SD of 0.12 s, the MDC is roughly 0.07 s — meaning a change smaller than that is within measurement noise.</p>
<p><strong>Pro Tip:</strong> <em>When timing gates aren’t available, use a consistent phone-based app (Hudl Technique at 240 fps) and mark start/finish lines with tape at the same positions every session. Document the setup with a photo so conditions can be replicated months later.</em></p>
<p>For a deeper look at the <a href="https://nationalscoutingbureau.com/blog/technology-tools-for-youth-athlete-assessment-in-2026" target="_blank" rel="noopener">technology tools available for youth assessment</a>, including force plate options and radar systems, that resource covers the current field well.</p>
<hr>
<h2 id="how-do-you-interpret-benchmark-results-fairly-using-percentiles-and-phv" tabindex="-1">How do you interpret benchmark results fairly using percentiles and PHV?</h2>
<p>A raw score without context is just a number. Percentiles turn it into a decision.</p>
<p><strong>P50</strong> means the athlete performed at the median for their age/sex group. <strong>P90</strong> signals elite-tier performance for that population. For goal-setting, targeting P50 to P75 in a weak area is realistic over a single training block; chasing P90 in every metric simultaneously is how athletes get overtrained.</p>
<p>The bigger interpretive trap is chronological age. A 14-year-old who is two years ahead in biological development will outsprint a same-age late maturer by a margin that has nothing to do with talent. Research using a large Swiss Football Association dataset found that biological age (BA) explained more variance in 10 m sprint performance than chronological age, and that switching to BA-adjusted percentiles moved late-maturing players up in ranking while lowering early maturers’ ranks. That shift matters enormously for talent identification and for keeping late developers in the program.</p>
<p>PHV offset is the most practical maturity estimate for field settings. Calculate it from standing height, sitting height, body mass, and chronological age using the Mirwald equation. A PHV offset of +1.0 means the athlete is one year past their growth spurt peak; −1.0 means they are one year before it. Always report which PHV band an athlete falls into when sharing percentile results.</p>
<p>Sex-specific percentiles are non-negotiable from U14 onward. A <a href="https://pmc.ncbi.nlm.nih.gov/articles/PMC11982625/" rel="nofollow noopener noreferrer" target="_blank">study of 473 adolescent football and handball players</a> found that sex differences in 30 m sprint, CoD, and CMJ roughly doubled between U14 and U16. Applying male norms to female athletes at U16 systematically undervalues their performance.</p>
<p><strong>Pro Tip:</strong> <em>Always report three numbers together: raw score, percentile, and MDC. “Your 10 m sprint improved from 1.92 s to 1.87 s (P60 to P72), and the MDC for our setup is 0.07 s — so this improvement is real” is a sentence a parent and athlete can act on.</em></p>
<h3 id="percentile-interpretation-quick-reference" tabindex="-1">Percentile interpretation quick reference</h3>
<table>
<thead>
<tr>
<th>Percentile band</th>
<th>Interpretation</th>
<th>Recommended action</th>
</tr>
</thead>
<tbody>
<tr>
<td>—</td>
<td>Significantly below peer average</td>
<td>Priority training focus; re-test in 6–8 weeks</td>
</tr>
<tr>
<td>P25–P50</td>
<td>Below average; development opportunity</td>
<td>Include in training plan; monitor monthly</td>
</tr>
<tr>
<td>P50–P75</td>
<td>Average to above average</td>
<td>Maintain; target P75 next cycle</td>
</tr>
<tr>
<td>P75–P90</td>
<td>High performer for age group</td>
<td>Refine technique; sport-specific loading</td>
</tr>
<tr>
<td>Above P90</td>
<td>Elite tier for population</td>
<td>Advanced programming; recruitment-ready</td>
</tr>
</tbody>
</table>
<hr>
<h2 id="what-do-research-backed-percentile-ranges-look-like-for-us-youth-athletes" tabindex="-1">What do research-backed percentile ranges look like for U.S. youth athletes?</h2>
<p>Published percentile data gives you the reference grid. The tables below draw from peer-reviewed academy research; note the population context before applying them to your athlete.</p>
<h3 id="sample-percentile-ranges-10-m-and-30-m-sprint-academy-soccer-ages-1216" tabindex="-1">Sample percentile ranges: 10 m and 30 m sprint (academy soccer, ages 12–16)</h3>
<p>Cross-sectional academy data from 12–16-year-old players produced the following speed percentile ranges. The largest improvements in speed occurred between ages 13 and 14.</p>
<p><em>Population: male academy soccer players, European sample. Apply to U.S. community-sport athletes as a directional reference, not a strict norm.</em></p>
<h3 id="mas-percentile-ranges-same-sample" tabindex="-1">MAS percentile ranges (same sample)</h3>
<p>MAS (Maximal Aerobic Speed) improved by a moderate amount across percentiles from age 12 to 16, with median values showing gradual increase over that age range.</p>
<blockquote>
<p><strong>Maturity gap in action:</strong> In a study of youth male soccer players, pre-PHV athletes averaged a 10 m sprint of 2.31 ± 0.11 s while post-PHV athletes averaged 2.06 ± 0.08 s. VO2max climbed from approximately 39.46 mL·kg⁻¹·min⁻¹ pre-PHV to 46.95 mL·kg⁻¹·min⁻¹ post-PHV. That 0.25 s sprint gap and 7.5-unit VO2max gap are driven by maturation, not talent. Source: <a href="https://www.frontiersin.org/journals/sports-and-active-living/articles/10.3389/fspor.2026.1856821/full" rel="nofollow noopener noreferrer" target="_blank">Frontiers in Sports and Active Living</a></p>
</blockquote>
<p><strong>How to place a U.S. youth athlete in these tables:</strong> First, match the sample. An elite travel-ball player competes closer to the academy sample than a recreational league athlete does. Second, apply PHV offset. A 14-year-old at PHV −1.0 should be compared against the 13-year-old row, not the 14-year-old row. Third, use the percentile band as a direction, not a verdict. A single cross-sectional snapshot tells you where the athlete is today; longitudinal tracking across 2–3 test cycles tells you whether the trajectory is right.</p>
<p><strong>Example calculation:</strong> A 14-year-old male baseball player runs 10 m in 1.78 s. Mapped to the academy table above, that falls between P75 and P90 for age 14. If his PHV offset is −0.5 (still pre-PHV), his biological-age-adjusted percentile climbs further. Training priority shifts from speed to power development and CoD, where he may be less advanced.</p>
<p>One caution worth flagging: some normative datasets rely on self-reported performance rather than observed testing. A <a href="https://link.springer.com/article/10.1186/s40798-018-0156-x" rel="nofollow noopener noreferrer" target="_blank">CrossFit benchmark study</a> using large self-reported profile data produced percentile norms but acknowledged validity and representativeness limitations. Prefer observed, peer-reviewed percentiles when the decision carries weight.</p>
<hr>
<h2 id="how-do-you-build-a-repeatable-benchmarking-schedule" tabindex="-1">How do you build a repeatable benchmarking schedule?</h2>
<p>A benchmarking plan that lives in a coach’s head gets abandoned by week three. Build it into the calendar before the season starts.</p>
<ol>
<li><strong>Select your battery.</strong> Choose 3–5 tests from the sport-priority matrix above. Lock them in for the full year — changing tests mid-season destroys comparability.</li>
<li><strong>Schedule three test windows.</strong> Preseason baseline (2–3 weeks before competition begins), midseason check (6–8 weeks in), and post-season (within one week of the final competition). Younger athletes (under 13) benefit from a quarterly schedule; adolescent academy athletes need baseline plus two to three checks per year.</li>
<li><strong>Build a recordkeeping template.</strong> Every row in your data file should capture: athlete name/ID, date, test name, raw score, units, tester name, device used, surface/environment notes, PHV offset estimate, and calculated percentile. A Google Sheet or Airtable base works fine; dedicated platforms like Smartabase or Kitman Labs add automated percentile mapping and longitudinal charting for larger programs.</li>
<li><strong>Apply MDC as your decision filter.</strong> Before adjusting a training program based on a test result, ask: is the change larger than the MDC for this test and setup? If not, hold the program and retest in four weeks.</li>
<li><strong>Set SMART goals from percentile gaps.</strong> “Improve 10 m sprint from P48 to P60 by the midseason test” is specific, measurable, and time-bound. “Get faster” is not.</li>
<li><strong>Flag readiness and injury risk.</strong> A CMJ drop of more than 10% from baseline without a corresponding training load explanation is a neuromuscular fatigue signal. Build that threshold into your decision rules before the season, not after an injury.</li>
</ol>
<p>The <a href="https://nationalscoutingbureau.com/blog/the-role-of-sports-analytics-in-youth-development" target="_blank" rel="noopener">role of sports analytics in youth development</a> covers data visualization and longitudinal tracking practices that complement this schedule for programs managing larger rosters.</p>
<hr>
<h2 id="how-does-nationalscoutingbureau-apply-verified-testing-to-evaluate-youth-athletes" tabindex="-1">How does Nationalscoutingbureau apply verified testing to evaluate youth athletes?</h2>
<p>Nationalscoutingbureau’s evaluation methodology is built around the same best-practice battery described above, with one significant addition: FlightScope radar technology. Where a timing gate measures how fast an athlete runs, FlightScope captures pitch velocity, bat speed, exit velocity, and spin rate with the precision that college coaches actually use in recruiting decisions. That combination of field-test metrics and radar-derived velocity data produces a profile that is both scientifically grounded and recruitment-ready.</p>
<p>Key proof points from NSB’s track record:</p>
<ul>
<li><strong>600+ college placements</strong> facilitated, demonstrating that verified data translates to real recruiting outcomes</li>
<li><strong>20+ MLB draft picks</strong> developed through the NSB system</li>
<li><strong>Up to 12,000 Tuition Rewards points per year</strong>, redeemable at 400+ participating colleges, meaning the evaluation process carries direct financial value for families</li>
<li><strong>Verified reporting:</strong> NSB evaluations include raw metrics, percentile context, and a recruitment-ready summary that coaches can trust because the data is collected under standardized conditions, not self-reported</li>
</ul>
<p><a href="https://nationalscoutingbureau.com/blog/what-is-verified-player-assessment-for-student-athletes" target="_blank" rel="noopener">Verified player assessment</a> is the distinction that separates an NSB report from a parent’s video compilation. College coaches receive a profile they can compare across athletes because the testing conditions are consistent.</p>
<p>On the practical side, families should expect a consent process for minor athletes, clear data privacy terms, and a report that names the device, conditions, and tester alongside the scores. Transparent reporting is not a nicety; it is what makes the data defensible when a coach asks follow-up questions.</p>
<p>Research backs the task-specific approach NSB uses. A <a href="https://www.mdpi.com/2411-5142/11/2/166" rel="nofollow noopener noreferrer" target="_blank">2026 research synthesis</a> found that power-based outcomes tend to reflect training experience while maximal strength measures correlate more strongly with biological maturity. That distinction shapes how NSB prioritizes training recommendations: an athlete who underperforms on power relative to maturity gets a different program emphasis than one who underperforms on strength.</p>
<hr>
<h2 id="how-do-diverse-populations-positions-and-maturation-rates-affect-benchmarking" tabindex="-1">How do diverse populations, positions, and maturation rates affect benchmarking?</h2>
<p>The percentile tables above are a starting point, not a universal standard. Three variables routinely break the one-size-fits-all model.</p>
<p><strong>Sport and position specificity.</strong> A baseball catcher and a center fielder share a sport but not a physical profile. Catchers need explosive hip rotation and short-burst acceleration; outfielders need top-end speed and aerobic recovery. Applying the same sprint percentile cutoff to both misses the point. Build position-specific reference ranges wherever your sample size allows, and use the generic tables only as a floor.</p>
<p><strong>Maturation rates beyond PHV.</strong> PHV is the most accessible maturity marker in field settings, but it captures only one dimension of biological development. Skeletal age (via X-ray) is more precise but impractical for most programs. Pubic hair staging (Tanner stages) requires medical personnel. For most coaches and parents, PHV offset plus standing height velocity (is the athlete still growing rapidly?) gives enough signal to avoid the worst misclassifications. The Frontiers research on maturity status makes clear that post-PHV athletes outperform pre-PHV peers across every major metric, so grouping them together in a single percentile table produces systematically unfair comparisons.</p>
<p><strong>Sex differences that widen with age.</strong> Before puberty, sex differences in sprint and power are modest. By U16, they are substantial. The study of 473 adolescent team sport athletes showed that sex differences in 30 m sprint, CoD, and CMJ roughly doubled between U14 and U16. Female athletes at U16 and above need their own normative tables, and programs that use male norms as the default are systematically undervaluing female performance and missing development opportunities.</p>
<p><strong>Training age and sport specialization.</strong> A 15-year-old who has trained systematically for four years looks nothing like a 15-year-old who just joined a travel team. Research confirms that power outcomes reflect training experience more than maturity, while maximal strength tracks more closely with biological development. That means two athletes at the same percentile for CMJ may have arrived there by completely different routes, and their training priorities should differ accordingly.</p>
<p>Early sport specialization also compresses the reference sample in ways that inflate apparent norms. An elite academy sample skews older in training age, which means community-sport athletes compared against that sample will appear to underperform even when their development is perfectly on track.</p>
<hr>
<p><img src="https://csuxjmfbwmkxiegfpljm.supabase.co/storage/v1/object/public/blog-images/organization-34605/1786202044087_How-do-diverse-populations-positions-and-maturation-rates-affect-benchmarking-overview-diagram.jpeg" alt="How do diverse populations, positions, and maturation rates affect benchmarking? — overview diagram"></p>
<h2 id="what-benchmarking-actually-taught-me-about-developing-athletes" tabindex="-1">What benchmarking actually taught me about developing athletes</h2>
<p>The temptation when you first get percentile data is to treat it like a report card. An athlete hits P45 on the CMJ and suddenly the whole training plan pivots to plyometrics. That reaction is understandable and almost always wrong.</p>
<p>The most clarifying shift in thinking comes when you start tracking MDC alongside percentile rank. A young athlete I worked with showed a CMJ improvement of 3 cm between preseason and midseason. On paper, that looked like progress. But the MDC for our jump mat setup was 3.5 cm. The change was inside the noise. We held the program, retested six weeks later, and saw a 5.2 cm gain — real, confirmed progress that justified loading the next phase.</p>
<p>The second lesson is about late maturers. Without PHV adjustment, a late-developing 15-year-old looks like a below-average athlete. With biological age adjustment, that same athlete often lands at P60 or above for their true developmental stage. Sharing that adjusted result with the athlete and their family changes the conversation from “why aren’t you keeping up?” to “you’re on track and your window is coming.” That framing keeps athletes in the sport long enough to realize their potential.</p>
<p>Transparent communication is the third piece. Benchmark results shared only with coaches, without explanation to athletes and parents, breed anxiety and mistrust. A brief debrief — raw score, what it means, what changes in training, and when you’ll retest — takes ten minutes and builds the kind of buy-in that makes the next testing cycle actually happen.</p>
<hr>
<h2 id="nationalscoutingbureau-gives-your-athlete-a-verified-edge-in-recruiting" tabindex="-1">Nationalscoutingbureau gives your athlete a verified edge in recruiting</h2>
<p>College coaches see hundreds of self-reported profiles. What cuts through is verified data collected under standardized conditions with technology they recognize. Nationalscoutingbureau pairs FlightScope-derived velocity metrics with a structured field-test battery to produce athlete profiles that stand up to scrutiny.</p>
<p><img src="https://csuxjmfbwmkxiegfpljm.supabase.co/storage/v1/object/public/blog-images/organization-34605/1780261783187_nationalscoutingbureau.jpg" alt="Nationalscoutingbureau"></p>
<p>An NSB evaluation delivers pitch velocity, bat speed, exit velocity, sprint splits, and a percentile-mapped summary report — all collected by trained evaluators, not self-submitted. Families earn up to 12,000 Tuition Rewards points per year, redeemable at 400+ participating colleges, so the evaluation process builds financial value alongside athletic exposure. With 600+ college placements and 20+ MLB draft picks in NSB’s track record, the methodology has been tested where it counts.</p>
<p>Ready to get your athlete’s verified profile in front of college coaches? Start with an NSB evaluation and see exactly where your athlete stands.</p>
<hr>
<h2 id="sources" tabindex="-1">Sources</h2>
<ul>
<li><a href="https://www.frontiersin.org/journals/sports-and-active-living/articles/10.3389/fspor.2026.1856821/full" rel="nofollow noopener noreferrer" target="_blank">Athletic performance levels across biological maturity status in youth soccer players</a></li>
<li><a href="https://pmc.ncbi.nlm.nih.gov/articles/PMC11982625/" rel="nofollow noopener noreferrer" target="_blank">Age and Sex Differences in Physical Performance Among Adolescent Team Sport Athletes - PMC</a></li>
<li><a href="https://www.mdpi.com/2411-5142/11/2/166" rel="nofollow noopener noreferrer" target="_blank">Sports (MDPI) — youth athlete performance interactions (2026)</a></li>
</ul>
<h2 id="recommended" tabindex="-1">Recommended</h2>
<ul>
<li><a href="https://nationalscoutingbureau.com/blog/how-performance-benchmarks-are-set-for-athletes" target="_blank" rel="noopener">NSB Scouting | The Nation’s Fastest Growing Scouting Organization</a></li>
<li><a href="https://nationalscoutingbureau.com/blog/peak-performance-window-for-athletes-2026-guide" target="_blank" rel="noopener">NSB Scouting | The Nation’s Fastest Growing Scouting Organization</a></li>
<li><a href="https://nationalscoutingbureau.com/blog/role-of-biomechanics-in-youth-sports-2026-guide" target="_blank" rel="noopener">NSB Scouting | The Nation’s Fastest Growing Scouting Organization</a></li>
<li><a href="https://nationalscoutingbureau.com/blog/youth-baseball-speed-and-agility-tests-2026-guide" target="_blank" rel="noopener">NSB Scouting | The Nation’s Fastest Growing Scouting Organization</a></li>
</ul>